Let's race some Soup Cans
Introduction
This project explores how the moment of intertia of different object will affect their acceleration while rolling down a ramp. We compare two cans of soup: A Chicken Broth and A Cream of Mushroom. These two soup cans have the same total mass and radius, but their contents are different. In the case of the broth, the soup is essentially water-like and won't rotate much as the can rolls down the ramp. The cream of mushroom however, is a gelatinous blob and will rotate with the can as it rolls. This creates different moments of inertia and should lead to different kinematics as the two cans roll down a ramp. We'll measure their positions using the Tracker motion software1 and analyze the results.
Moments of Inertia

Fig 1. The Two Soups cans and their geometry.
The first step will be to characterize the two cans. Fig. 1 shows the two cans with a schematic describing the geometry of a soup can. It is a cylinder with a diameters of 0.065 m and a height of 0.100 m. The mass of the soup itself is 0.298 kg as indicated on the label. Placing the entire can on a scale shows that the mass of the soup plus the can is 0.341 kg, thus the mass of the metal can itself can be assumed to be the difference: 0.341 kg - 0.298 kg = 0.043 kg.
| Component | Mass [kg] | $R$ [m] | $I$ (model) | $I$ | Symbol |
|---|---|---|---|---|---|
| Broth | 0.298 | 0.0325 | doesn't rotate | n/a | n/a |
| Mushroom Soup | 0.298 | 0.0325 | Solid Cylinder | $\frac{1}{2}M_\rm{mush} R^2$ | $I_\rm{mush}$ |
| Can walls | 0.0213 | 0.0325 | Hoop | $M_\rm{wall} R^2$ | $I_\rm{wall}$ |
| Can Caps | 0.0109 | 0.0325 | Solid Cylinder | $\frac{1}{2} M_\rm{cap} R^2$ | $I_\rm{cap}$ |
Table 1. The physical quantities needed to describe the moments of intertia.
Chicken Broth
The chicken broth, assuming the liquid doesn't rotate, will effectively just rotate the can, and not the broth. We can model the can as made up of three components: a) the cylindrical hoop, and b) the two circles that make up the upper and lower lids.
$$I_\textrm{CB} = I_\textrm{wall}+ 2 \times I_\rm{cap}$$Cream of Mushroom
The cream of mushroom will have the same $I$ from the can component as the Chicken Broth, but there will also be a solid cylinder of rotating Mushroom soup.
$$I_\textrm{CB} = I_\textrm{wall}+ 2 \times I_\rm{cap} + I_\textrm{mush}$$| Object | Calculated $I$ [kg m2] |
|---|---|
| $I_\textrm{CB}$ | $3.40641 \times 10^{-5}$ |
| $I_\textrm{CoM}$ | $1.91445 \times 10^{-4}$ |
Table 2. The calculated moments of inertia.
Table 2 shows the results of the calculations for the moment of intertia for these two objects.
Kinematics and Dynamics
The following shows how we can use Newton's Laws to predict the acceleration of an object rolling down a ramp1. Fig. 2 shows a free body diagram of a cylinder on a ramp. The angle $\theta$ is defined in the picture, and the three forces acting on the mass are shown as vectors. The component of Gravity parallel to the ramp is also included.
Fig 2. Free Body Diagram showing the forces acting on a cylinder while on a ramp. Only $f_S$ will create a torque.
Starting with the rotational version of Newton's law:
\begin{equation} \tau = I \alpha \end{equation}we can consider the forces that will contribute to a rotation of the disk.
The only force acting with a perpendicular component is friction.
$$Rf_s = \tau = I \alpha$$Since $\alpha = -a_\textrm{com}/R$
$$f_s = -I_\textrm{com} \frac{a_\textrm{com}}{R^2}$$But, we can also consider the sum of forces along the surface of the ramp:
$$\Sigma F_\parallel = {F_G}_\parallel + \textrm{friction} = m a_\textrm{com}$$Plug some stuff in:
$$Mg\sin \theta - I_\textrm{com}\frac{a_\textrm{com}}{R^2} = ma_\textrm{com}$$Rearrange for $a_\textrm{com}$:
\begin{equation} a_\textrm{com} = \frac{g \sin \theta}{1+ I_\textrm{com}/MR^2} \label{eq:linearacceleration} \end{equation}This result will be used to calculate analytically the expected motions of the soup cans and compare with the results of the measurements.
The Race
The Measurement
We recorded the race using a phone camera in the Slo-Motion mode, which records at 240 frames per second (see Fig. 3). This video was then analyzed using the tracker software to find positions and times. Both cans were placed at the top of the ramp and released using a board to ensure they being rolling at the same time.
Figure 3. The video record of the race
Analysis
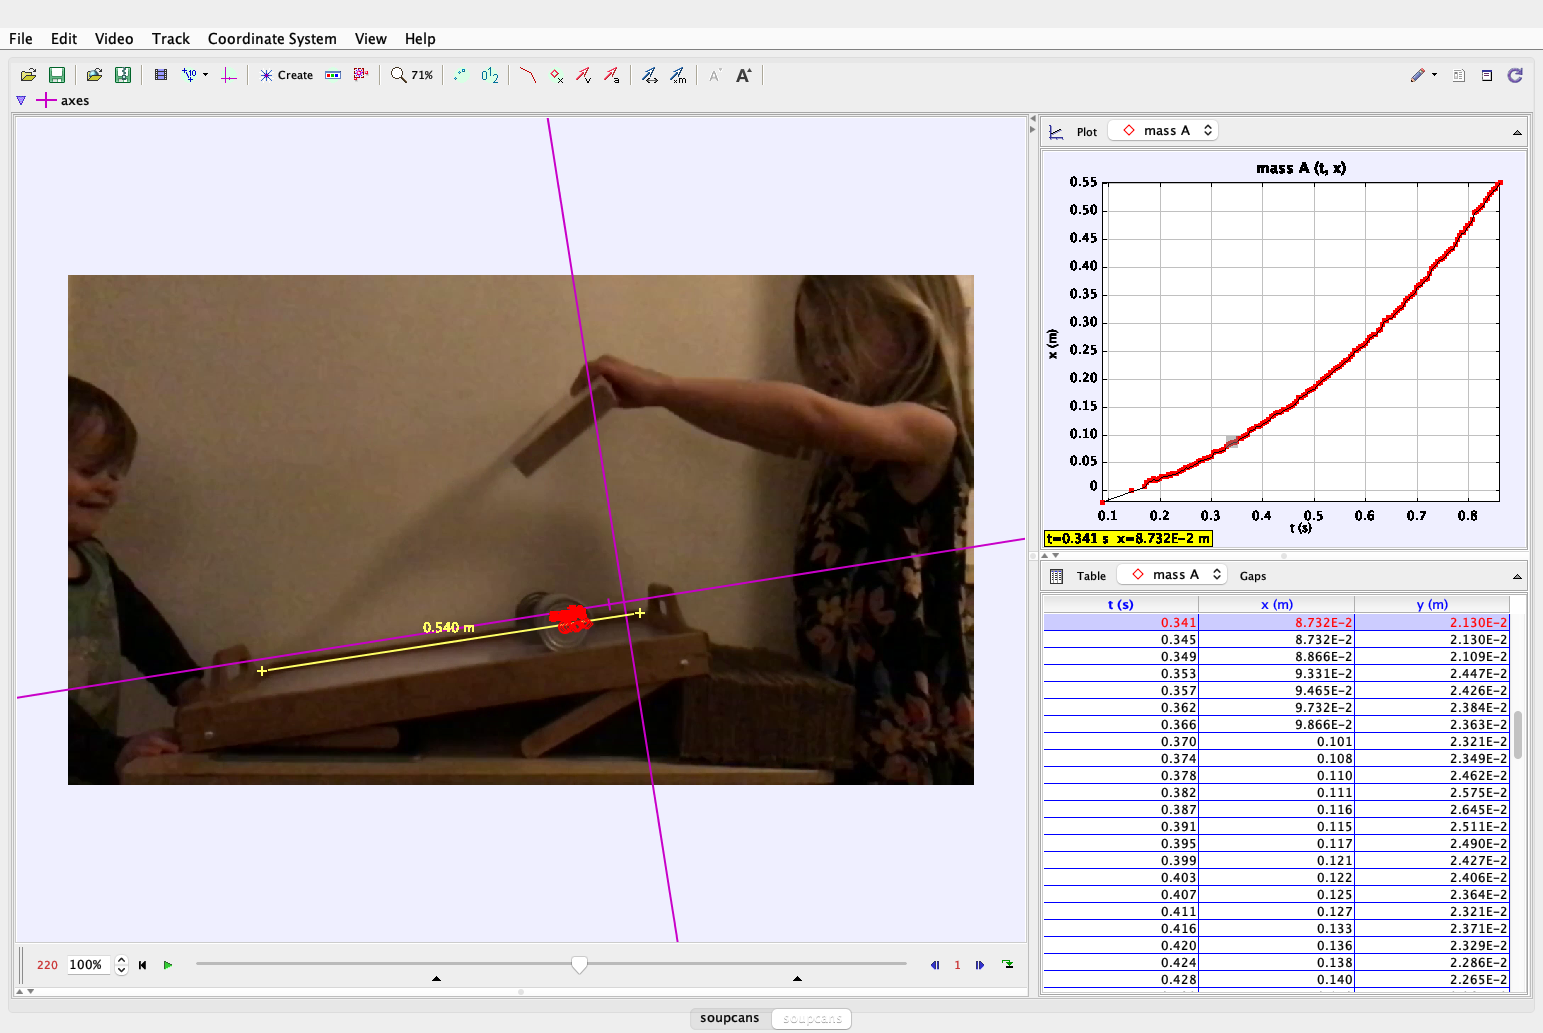
Figure 4. Screenshot from Tracker showing the video analysis in progress.
We first use Tracker to find the position as a function of time for one of the Soup Can. (see Fig. 4) Since Cream of Mushroom was more visible, we'll use that one. We adjusted the setting of the clip in tracker to account for the frame rate of 240 frames per second (FPS). A calibration stick was also added showing the length of the ramp which was measured to be 54 cm from end to end. We chose a coordinate axis parallel to the ramp, with an origin as close the initial starting position as posible. Unfortunately, the can was obscured by the board in the very beginning, but we can estimate the starting position nonetheless.
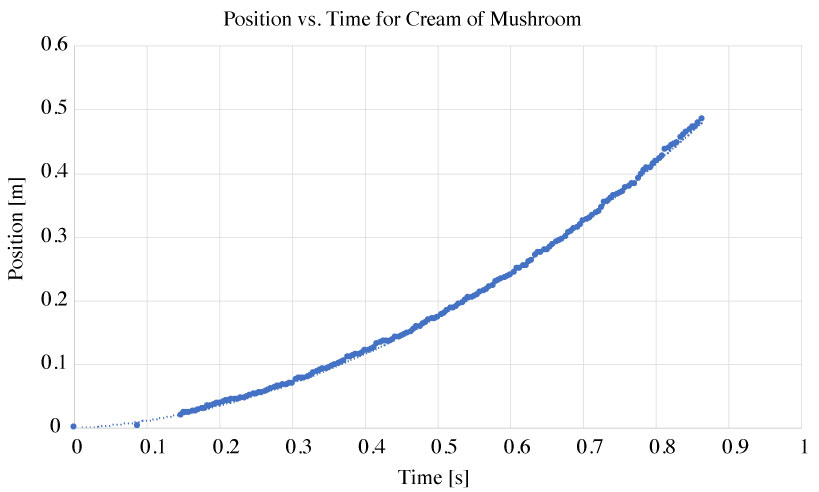
Fig 5. Plot of the x vs. time for the Cream of Mushroom can as it rolls without slipping down the ramp.
Fig. 5 shows a graph obtained from the calibrated video showing position as a function of time. A second order polynomial fit line is also shown in the graph.
There are a number of way to analyse the acquired data. We'll do a numerical derivate of the positions to obtain instantaneous velocity measurements at every in time: $$v = \frac{\Delta x}{\Delta t}$$
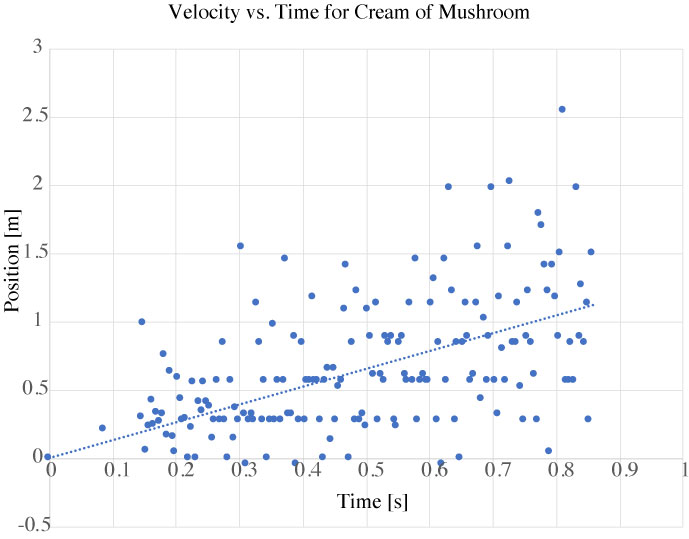
Fig 6. Plot of the v vs. time for the Cream of Mushroom can obtained by finding the change in position with respect to time from the Tracker data.
Fig. 6 shows the graph of the velocity value as calculated by the position measurements. We notice immediately that this data is very noisy. Ideally, this should be a smooth linearly increasing line. Instead, there is a wide range of values. Some even say 0.0 m/s at various times. This is likely due to poor placement of the marker during the Tracker video setup.
However, we can still make a fit to the data. Shown in the dashed line is a linear fit to the velocity data showing a linear line with a positve slope. The equation for the line is given as: $$v = 1.149 t$$
Thus we can say that the measured acceleration of the Cream of Mushroom soup as it rolls down the ramp was $$a = 1.149 \; \textrm{m/s}^2 $$
Using the calculation from Table 2, we can then compare this measured value to the predicted linear acceleration from equation \eqref{eq:linearacceleration}.
\begin{equation} a_\textrm{CoM} = \frac{g \sin \theta}{1+ I_\textrm{com}/MR^2} = \frac{9.8 \; \textrm{m/s}^2 \sin \left( 9^\circ \right) }{1+ \frac{1.91445 \times 10^{-4}\; \textrm{kg m}^2}{0.341 \; \textrm{kg } 0.0325^2 \; \textrm{m}^2}} = 1.001 \; \textrm{m/s}^2 \end{equation}We can see that the calculated acceleration is different than the measured and is about 15% less than what we measured. There are several possible sources for this discrepancy.
- It's possible the frame rate was not exactly 240 f.p.s as reported by the camera software.
- The video resolution is not great. This could lead to errors in either the distance calibration or the marking of the positions of the cans.
- The board obscured the can during the intial release thus making it hard to determine the actually starting time of the motion.
- The angle of the ramp was estimated to be 9 ° from the horizontal from the video frames. However, this value could be off and the experimentor failed to record it during the experiment.
Lastly, we return to the original question: Which can rolls faster down the ramp? From the video, it's obvious the Chicken Broth reaches the bottom of the ramp first. This is to be expected since it has a smaller Moment of Inertia as seen in Table 2. Thus, less potential energy will have to be converted to rotational kinetic energy, and the translational kinetaic energy will be greater, resulting in a faster speed at it rolls down the ramp. Since our video does not include a good view of the Chicken Broth can during the race, we won't perform the same details analysis. But, we can look at just the initial and final times and obtain an estimate of the acceleration that way.
From the video analyis, the Chicken Broth reaches the bottom after 0.758 seconds. The distance traveled is about 0.496 meters, as measured on the video frame. Thus we can use: \begin{equation} x = x_0 + v_0 t + \frac{1}{2}a t^2 \end{equation} to obtain an estimate of 1.736 m/s2 for the acceleration of the Chicken Broth from the video recorded. This is greater than then the predicted value of 1.401 m/s2 using equation \eqref{eq:linearacceleration} and the value of $I$ from table 2. While the difference is not too much, we believe a better recording would probably be necessary to improve our results.
Conclusions
The results of the video analysis align fairly well with the predicted analytical results, though there are certainly some discrepancies. To improve the experimental set up, one could use better lighting, and perhaps frame the scene better in order to not have so much error in the velocity calculations. But, the main objective was met. We showed that the acceleration of the Cream of Mushroom soup as it rolled down the slope was close to the predicted value, and furthermore, was less than the acceleration of the Chicken Broth.
References
- https://physlets.org/tracker/
- Adapted from Hedberg, J.; Notes on Introductory Physics: https://hedberg.ccnysites.cuny.edu/PHYS207/SPRING-2021/notespdf/PHYS20700-torque.pdf