Lab 1: Pressure vs. Height
PHYS 37100 - Fall 2021
Due: Sep 20th, 4 pm
The goal: use your phone's built in barometer to measure the height of something. Like a hill, or a building.
Instructions:
- Use the Science Journal App to record the pressure as you change your elevation. Available here: Arduino Science Journal
- Export the data as a CSV file.
- Use a program (please not excel) to plot your raw data
- Use the relation between height and air pressure to calculate the final change in height, $\Delta h$. (see below)
- Convert your plot so that it shows height vs. time, instead of pressure vs. time.
- Prepare a short document that has both plots of (P(t) and h(t)), and code you used to process your data. Compare your results to known elevation/altitude information.
Useful physics
The barometric pressure equation relates the atmostpheric pressure to height and other variables (like temperature, $g$, etc): \begin{equation} P=P_{b}\cdot \exp \left[{\frac {-g_{0}\cdot M\cdot (h-h_{b})}{R^{*}\cdot T_{b}}}\right] \end{equation} where:
- $P_b$ = reference pressure [Pa]
- $T_b$ = reference temperature [K]
- $h$ = height [m]
- $h_b$ = reference height [m]
- $R$ = universal gas constant [8.3144598 J/(mol $\cdot$ K) ]
- $g$ = acceleration due to gravity: 9.80 m/s2
- $M$ = molar mass of Earth's air: 0.0289644 kg/mol
More:
An example trial involved recording the pressure as I rode the elevator from the 13th floor of Marshak to the ground floor. Here is the data plotted. (The steps in the data likely are artifacts of the phone sensor's acquisition rate, i.e. it take a few seconds to record each point. If we could make the elevator go slower, then the steps would be less visible.)
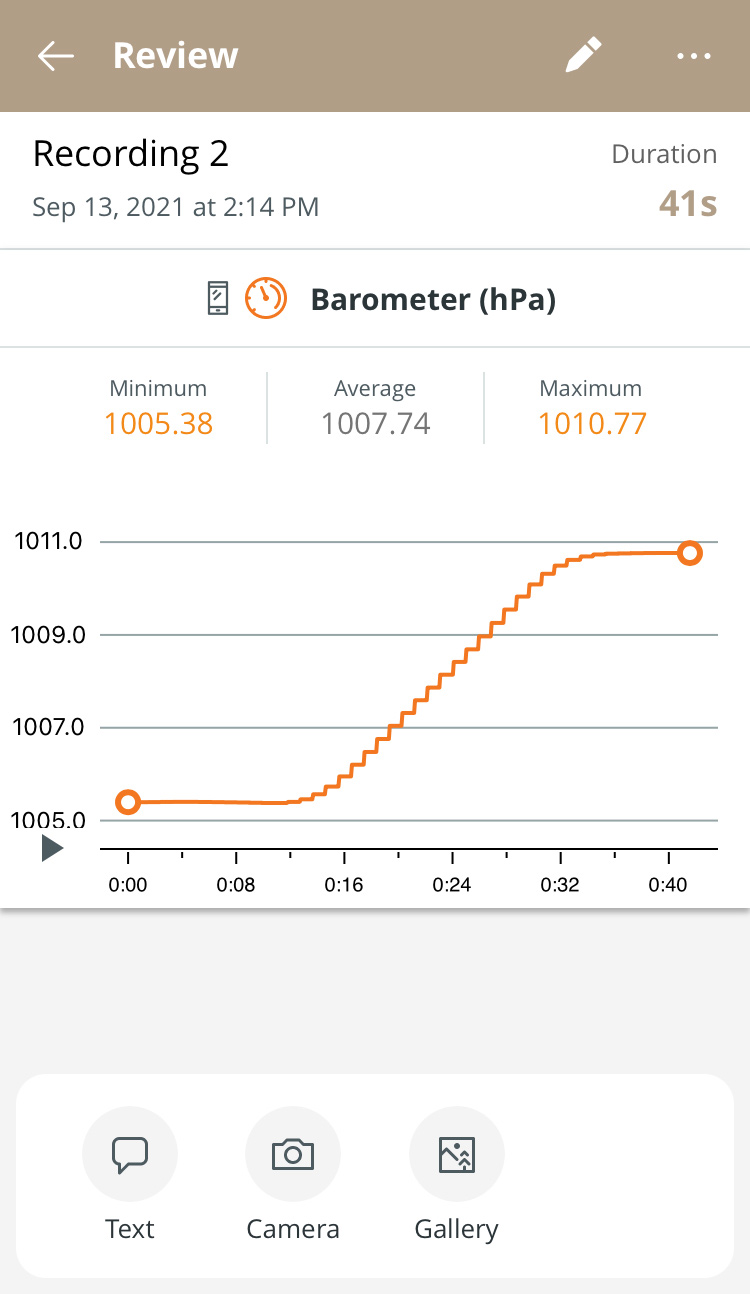
Science Journal Measurement of Pressure
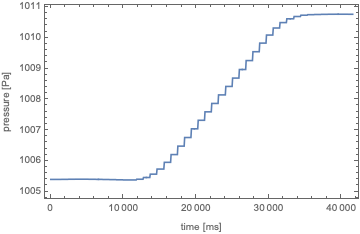
Mathematica Plot of the data
An example python script for viewing the data is here: Python (Goodle Colab)
Make sure you take a look at the tutorials on this page as well: Data Tutorials
Or you can try a Mathematica notebook [pdf] - though, I don't recommend Mathematica for data related work, it's a little awkward I find. It's great for numerical methods, and solving nasty functions, but it's not so smooth for data.
- First: import the data:
pressureData1 = Import["https://hedberg.ccnysites.cuny.edu/PHYS371/experiments/pressure-height/pressure-data.csv"] - Next, plot it:
ListPlot[pressureData]