Kinematics of the Elevators in the One World Trade Center
Introduction
A while ago, I took a ride in the elevators to the top of the One WTC. On the way up, we enjoyed the video display and marveled at the speed. On the way down, I recorded the acceleration of the cab using the Arduino Science Journal app and my phone. Here is the treatment of the data.
By placing the phone flat on the floor, and recording the accelerometer data, we can obtain a data set like the following. (Of interest are the two columns in red: time and z-acceleration. We also recorded the barometric pressure, which can be used to figure out elevation as well).
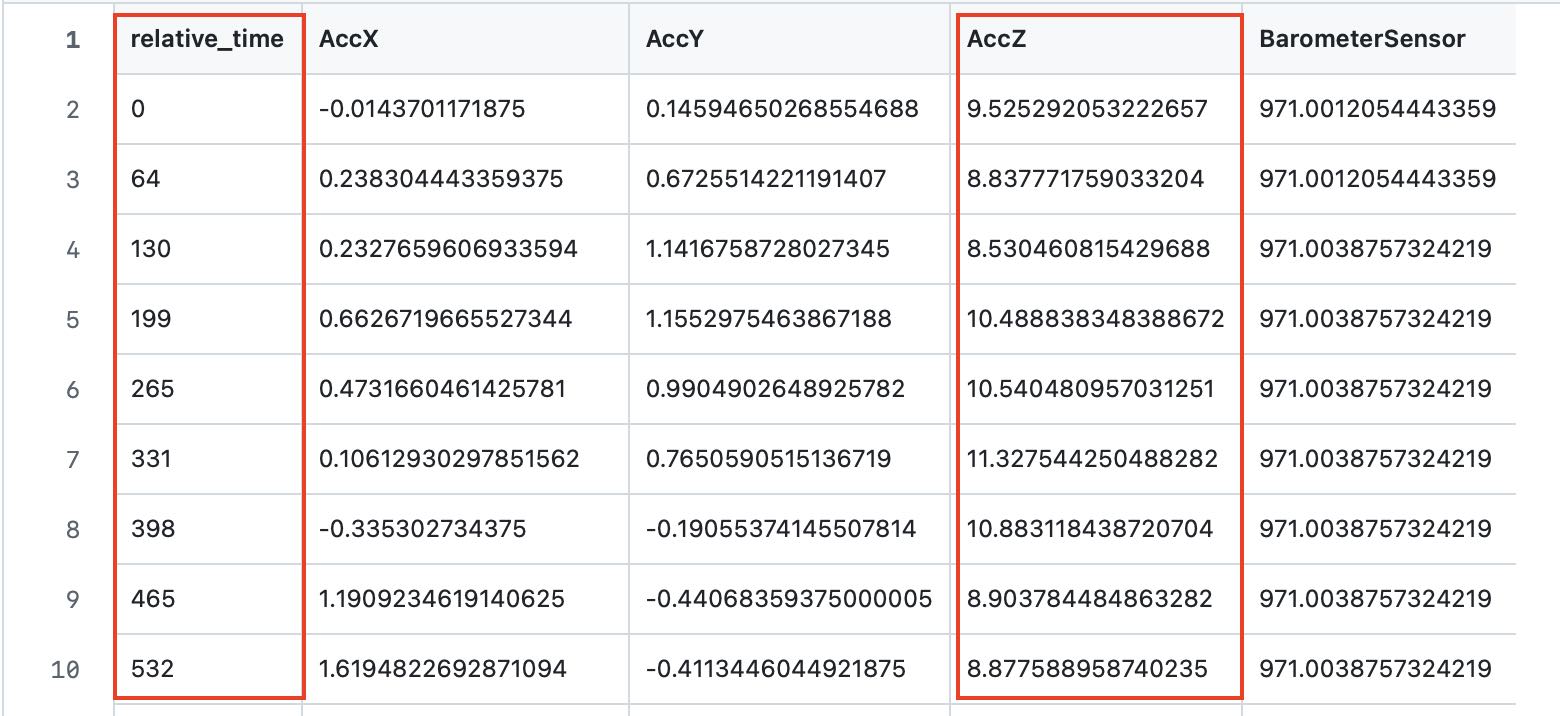
Fig 1. The raw data.
This data set can be found here: Elevator Acceleration Data
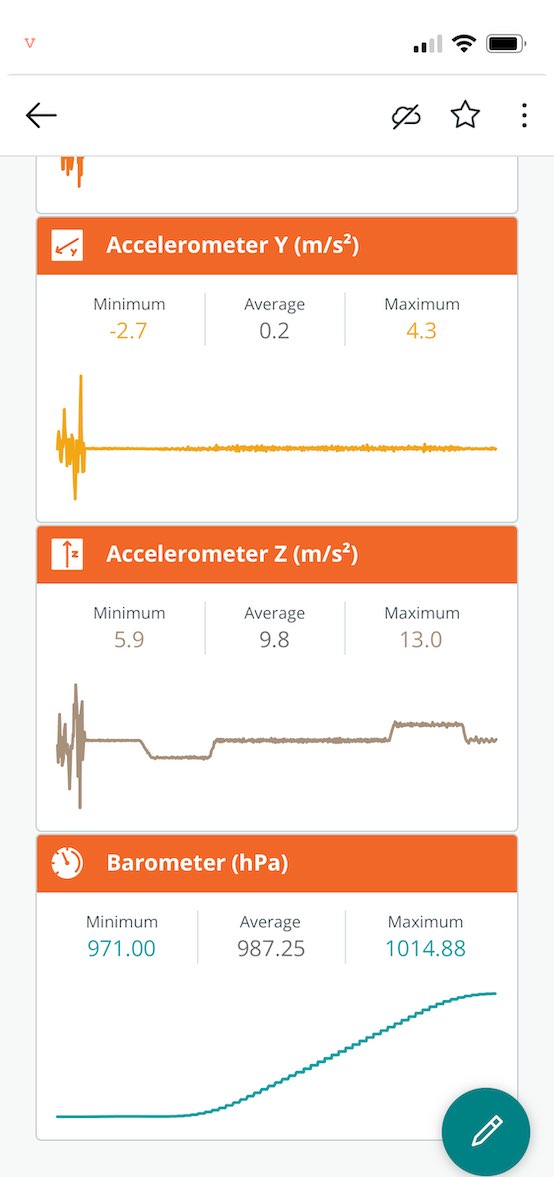
Fig 2. The Science Journal Display.
Processing the Data
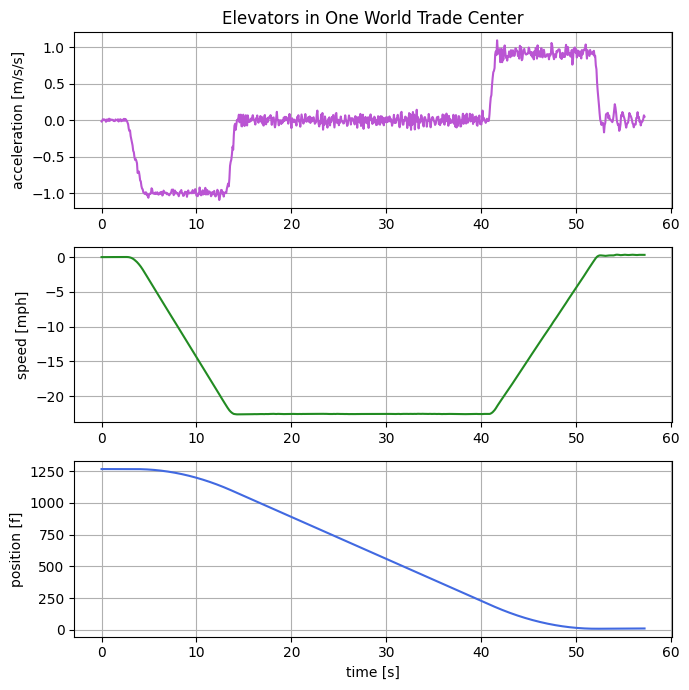
Fig 3. The three kinematic variables. The acceleration was recorded directly, the other two were computed using numerical integration.
All three kinematic variables plotted on the same horizontal time axis. The acceleration is at the top (that is the only thing you can actually measure inside the elevator). The velocity and position were then calculated using the basic relations between acceleration, speed, and position. $$ a = \frac{dv}{dt} = \frac{d^2 x}{dt^2} $$
Of note: the accelerative period lasts about 10 seconds. The acceleration is constant over that time and has a magnitude of about 1 m/s/s which is roughly 0.1 $g$.
Looking at the velocity information we can see that our top speed is calculated to be 22.6 mph. Which matches the engineering information we could locate: (thyssenkrupp). Most normal small building elevators would max out at around 5 mph. One WTC is not the fastest in the world. That distinction currently goes to the Shanghai Tower which has a top speed of about 45 mph.
The Final Results
It's informative to watch the data in a animated plot that is correlated with the visual representation of the building and elevator cab. On the left are the three plots of the kinematic variables. On the right is an approximate location of the cab's location in the building. The animation runs in real time, so you can get an idea of just how fast these vertical transportation systems are.
Fig 4. Here is an animated version of the data. We also show the approximate position of the elevator cab as a red dot on the actual building.
You can access the Colab notebook used to process the data here: Colab Notebook Link →

Fig 5. Oh yeah, and the view was pretty good too.