Devices
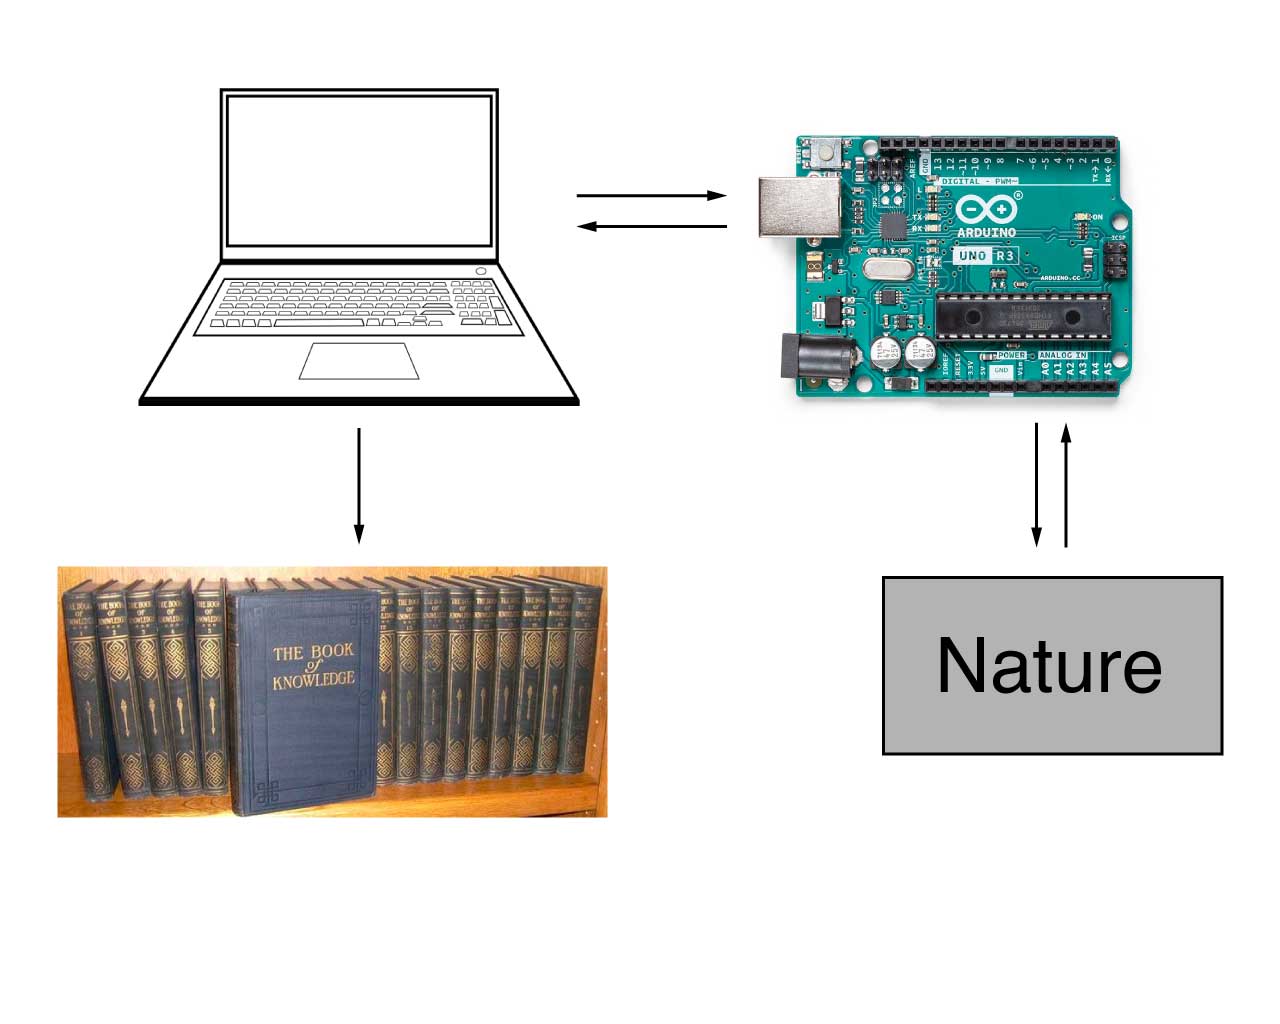
The general schematic for this class.
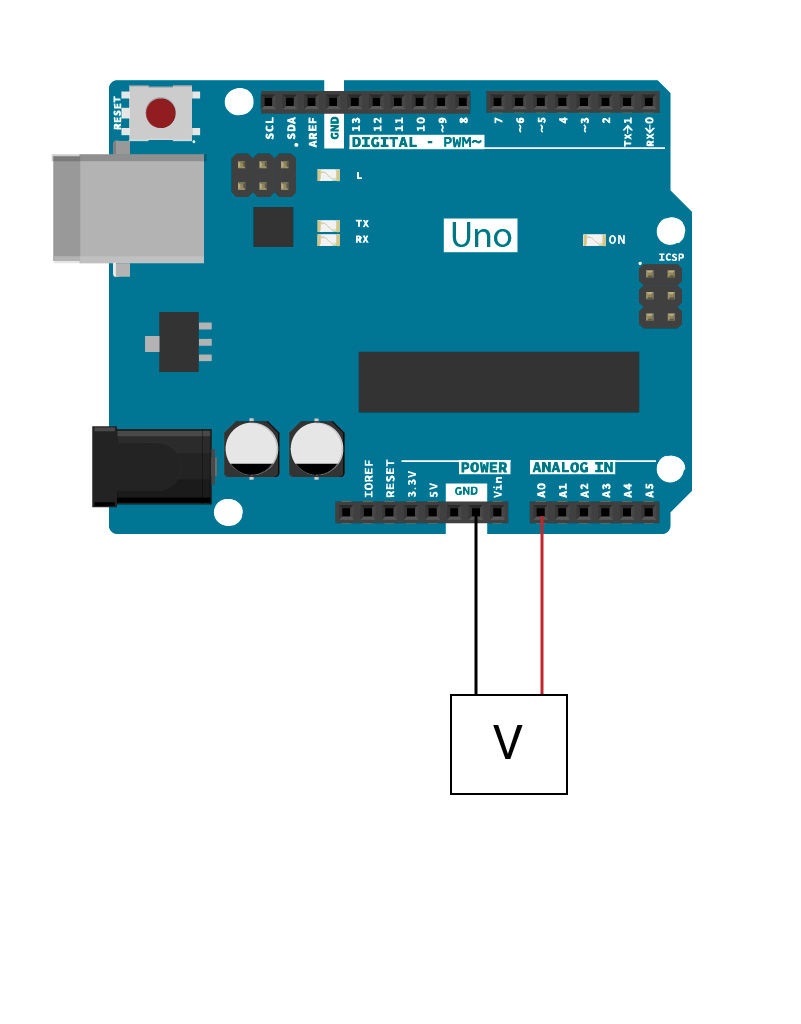
Voltage

      /*
        AnalogReadSerial

        Reads an analog input on pin 0, prints the result to the Serial Monitor.
        Graphical representation is available using Serial Plotter (Tools > Serial Plotter menu).
        Attach the center pin of a potentiometer to pin A0, and the outside pins to +5V and ground.

        This example code is in the public domain.

        https://www.arduino.cc/en/Tutorial/BuiltInExamples/AnalogReadSerial
      */

      // the setup routine runs once when you press reset:
      void setup() {
        // initialize serial communication at 9600 bits per second:
        Serial.begin(9600);
      }

      // the loop routine runs over and over again forever:
      void loop() {
        // read the input on analog pin 0:
        int sensorValue = analogRead(A0);
        // print out the value you read:
        Serial.println(sensorValue);
        delay(1);        // delay in between reads for stability
      }

The voltage divider
The Voltage Divider circuit is the easiest way to measure an unknown resistance. It has some limitations, but will essentially work for many applications $$ V_{\mathrm {out} }={\frac {R_{ref}}{R_{unknown}+R_{ref}}}\cdot V_{\mathrm {in} }$$
$R_?$
Let's consider the ways we can affect $R_?$.
The first equation you saw that even mentioned $R$ was probably Ohm's law. $$ R = \frac{V}{I} $$
Deeper look at $R$.
Consider the resistivity instead: $$ \rho = \frac{E}{J} $$
A little substitution leads to $$R = \rho \frac{L}{A}$$
A little more leads to a relation between resistivity and some of the properties of a particular material. $$ \rho = \frac{m}{e^2 n \tau}$$ ($m$ is the mass of an electron, $e$ its charge, $n$ is the electron density (i.e. carriers per volume), and $\tau$ is the mean free time (i.e. time between collisions) )
$R$ as a function of Temperature
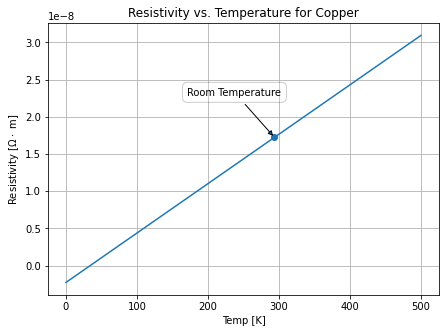
Resistivity vs. Temperature (linear)
One of the first discoveries is that the resistivity will change due to temperature. $$ \rho - \rho_0 = \rho_0 \alpha \left( T - T_0\right) $$
This relation is a linear approximation and is not sufficient for many situations. Though, for most metals within certain T ranges, it suffices.
Other materials/situations
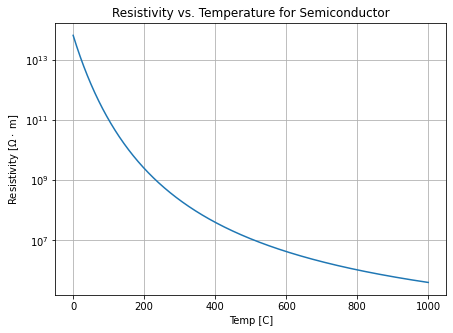
Resistivity vs. Temperature for an intrinsic semiconductor)
Very Low temperatures: superconductivity
Semiconductors, different relationship: $$\rho = \rho_0 e^{-a T}$$ (Note the log scale)
The Thermistor
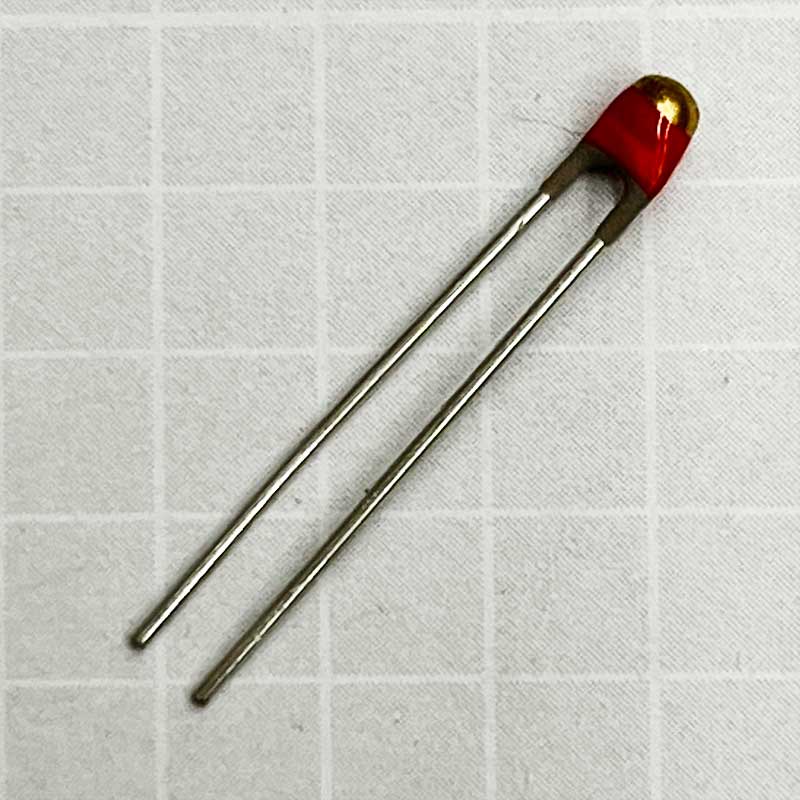
A Thermistor
These devices are designed to have resistance values that are very dependent on temperature. They are semi-conductors and can be custom made for specific temperature ranges.
The Steinhart–Hart equation approximates their temperature/resistance dependance. $$ \frac{1}{T}=A+B\ln R+C(\ln R)^{3} $$ where, $A$, $B$, and $C$ are constants specific to the actual device. (Note: there are several other forms of this equation. Use the product data sheet when you do your lab.)
Two kinds: NTC (Negative Temperature Coefficient) and PTC (Positive Temperature Coefficient)
Found in kitchens, living rooms, hospitals, labs, etc...
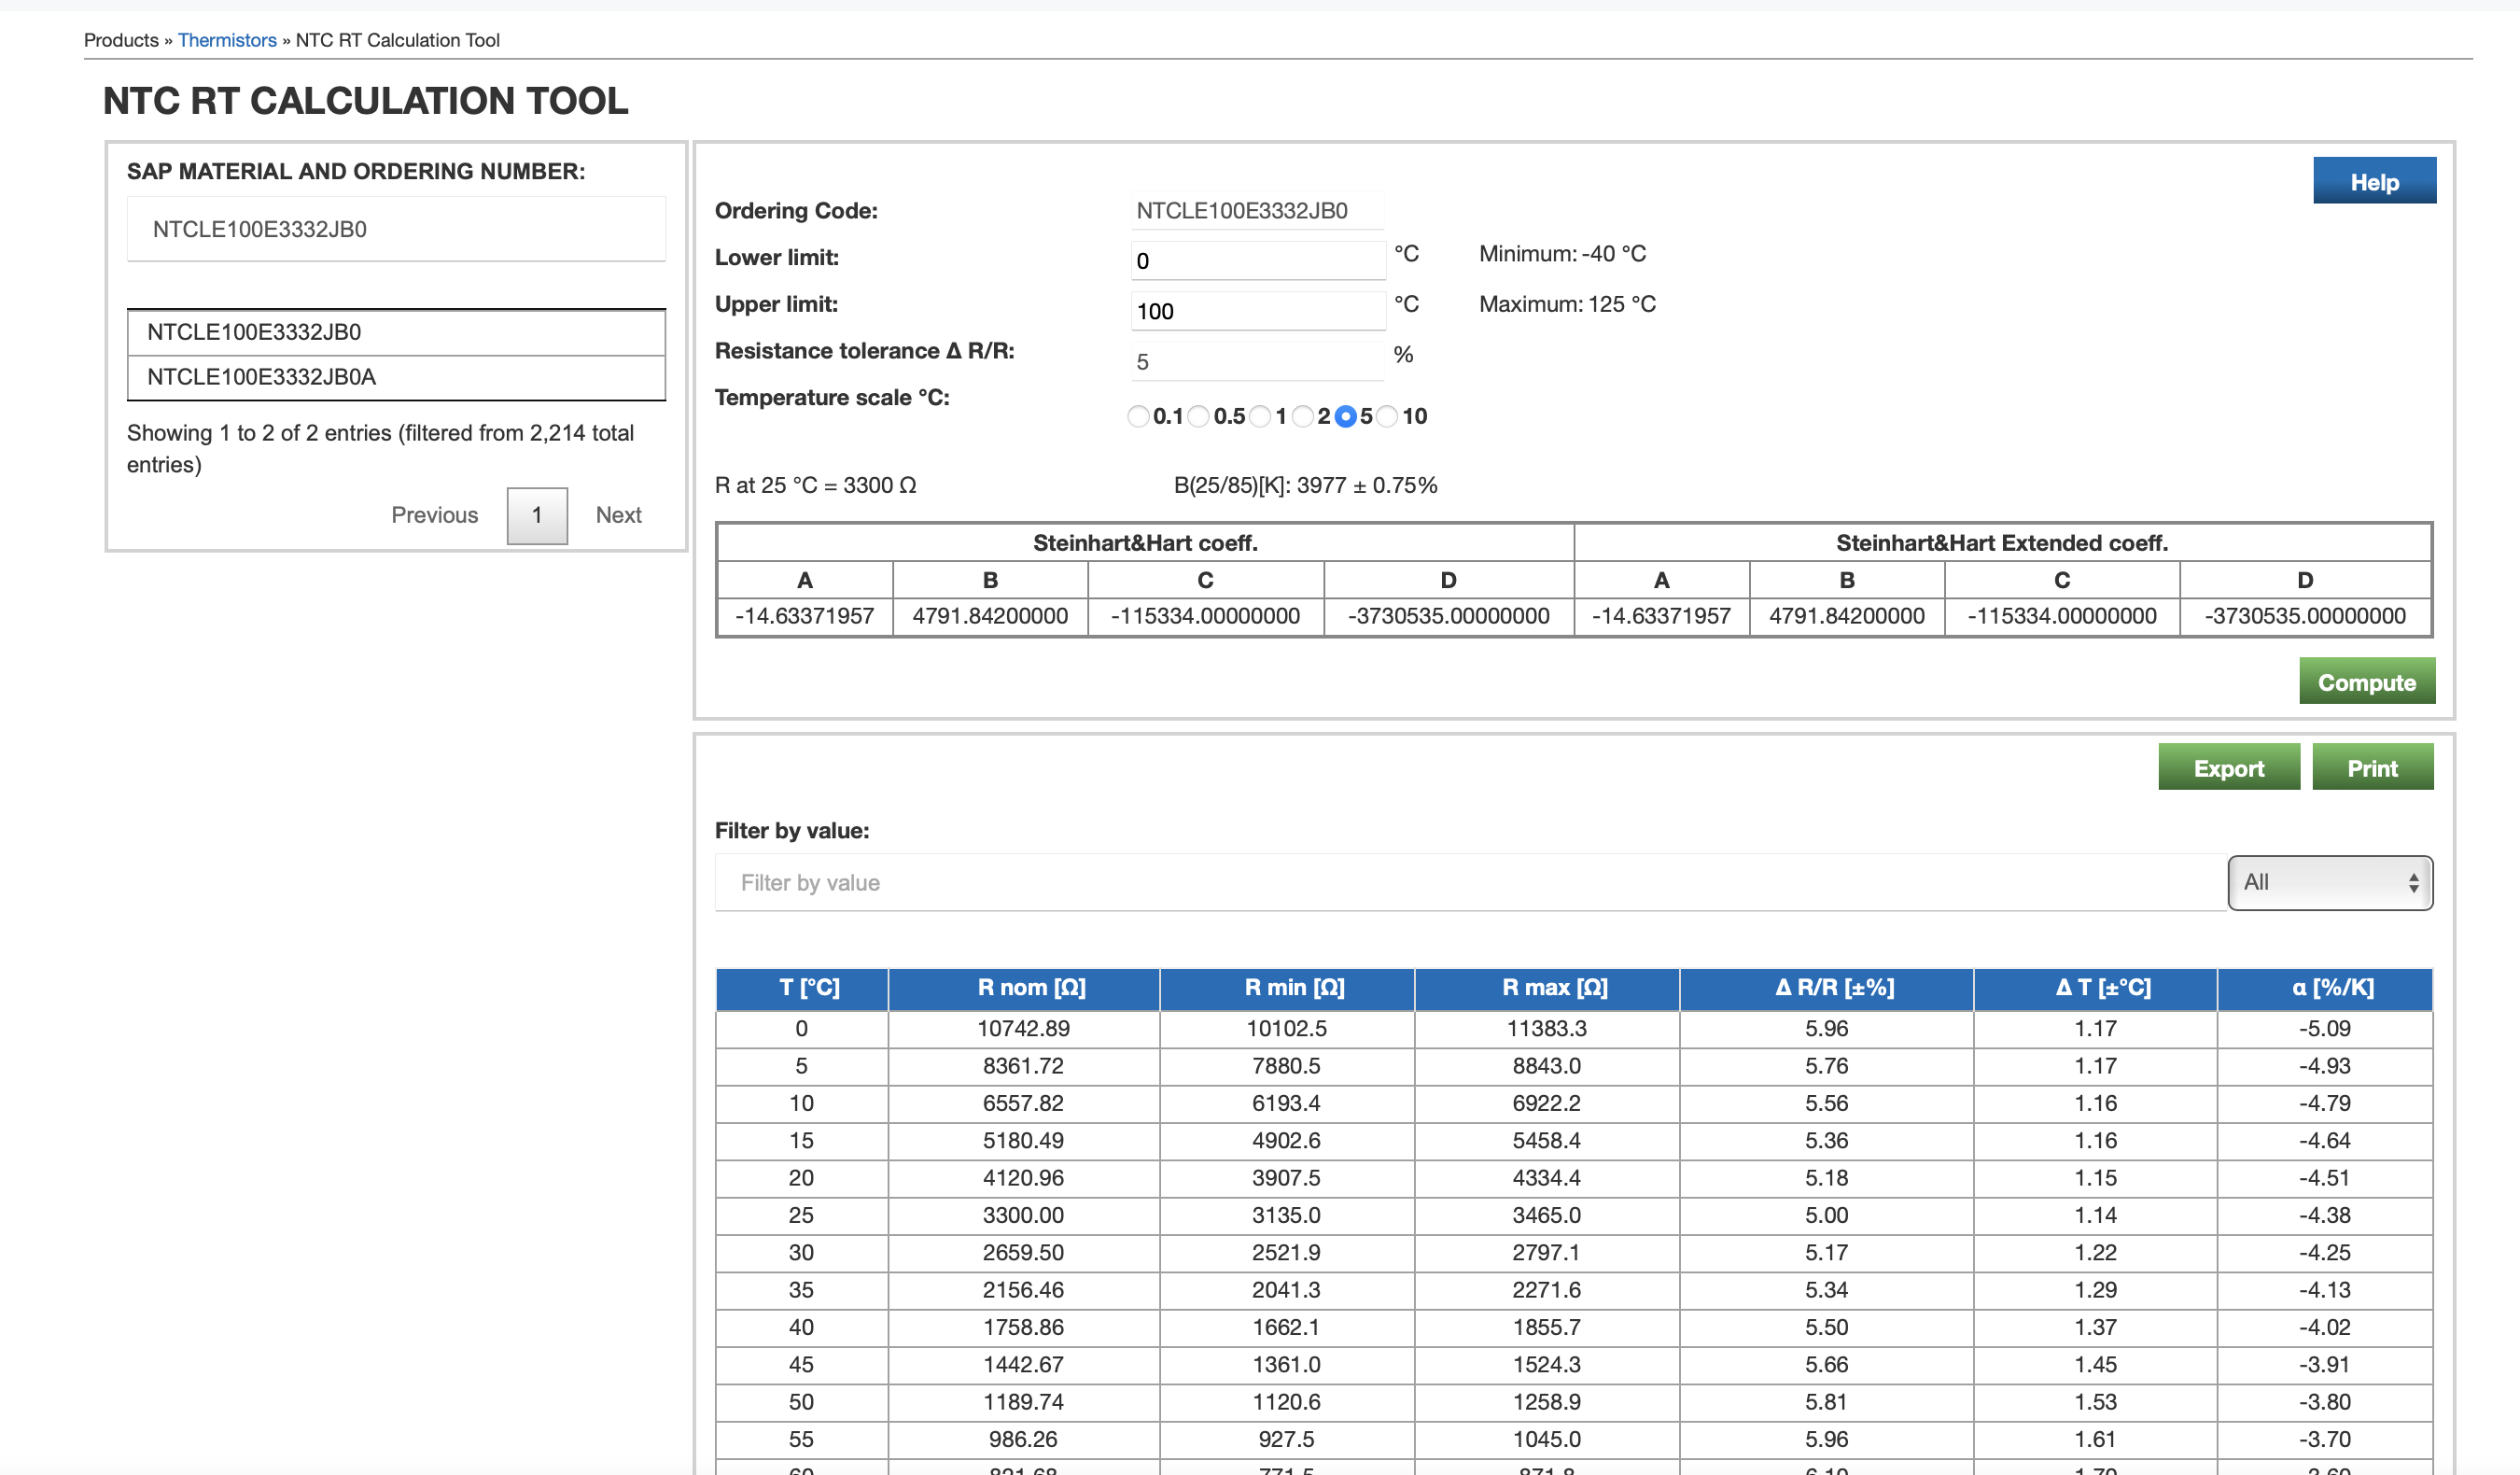
Calibration tool (online at https://www.vishay.com/en/thermistors/ntc-rt-calculator/
Measuring T with arduino
It's not much different than what we did before, except now we have a time variable to record also.
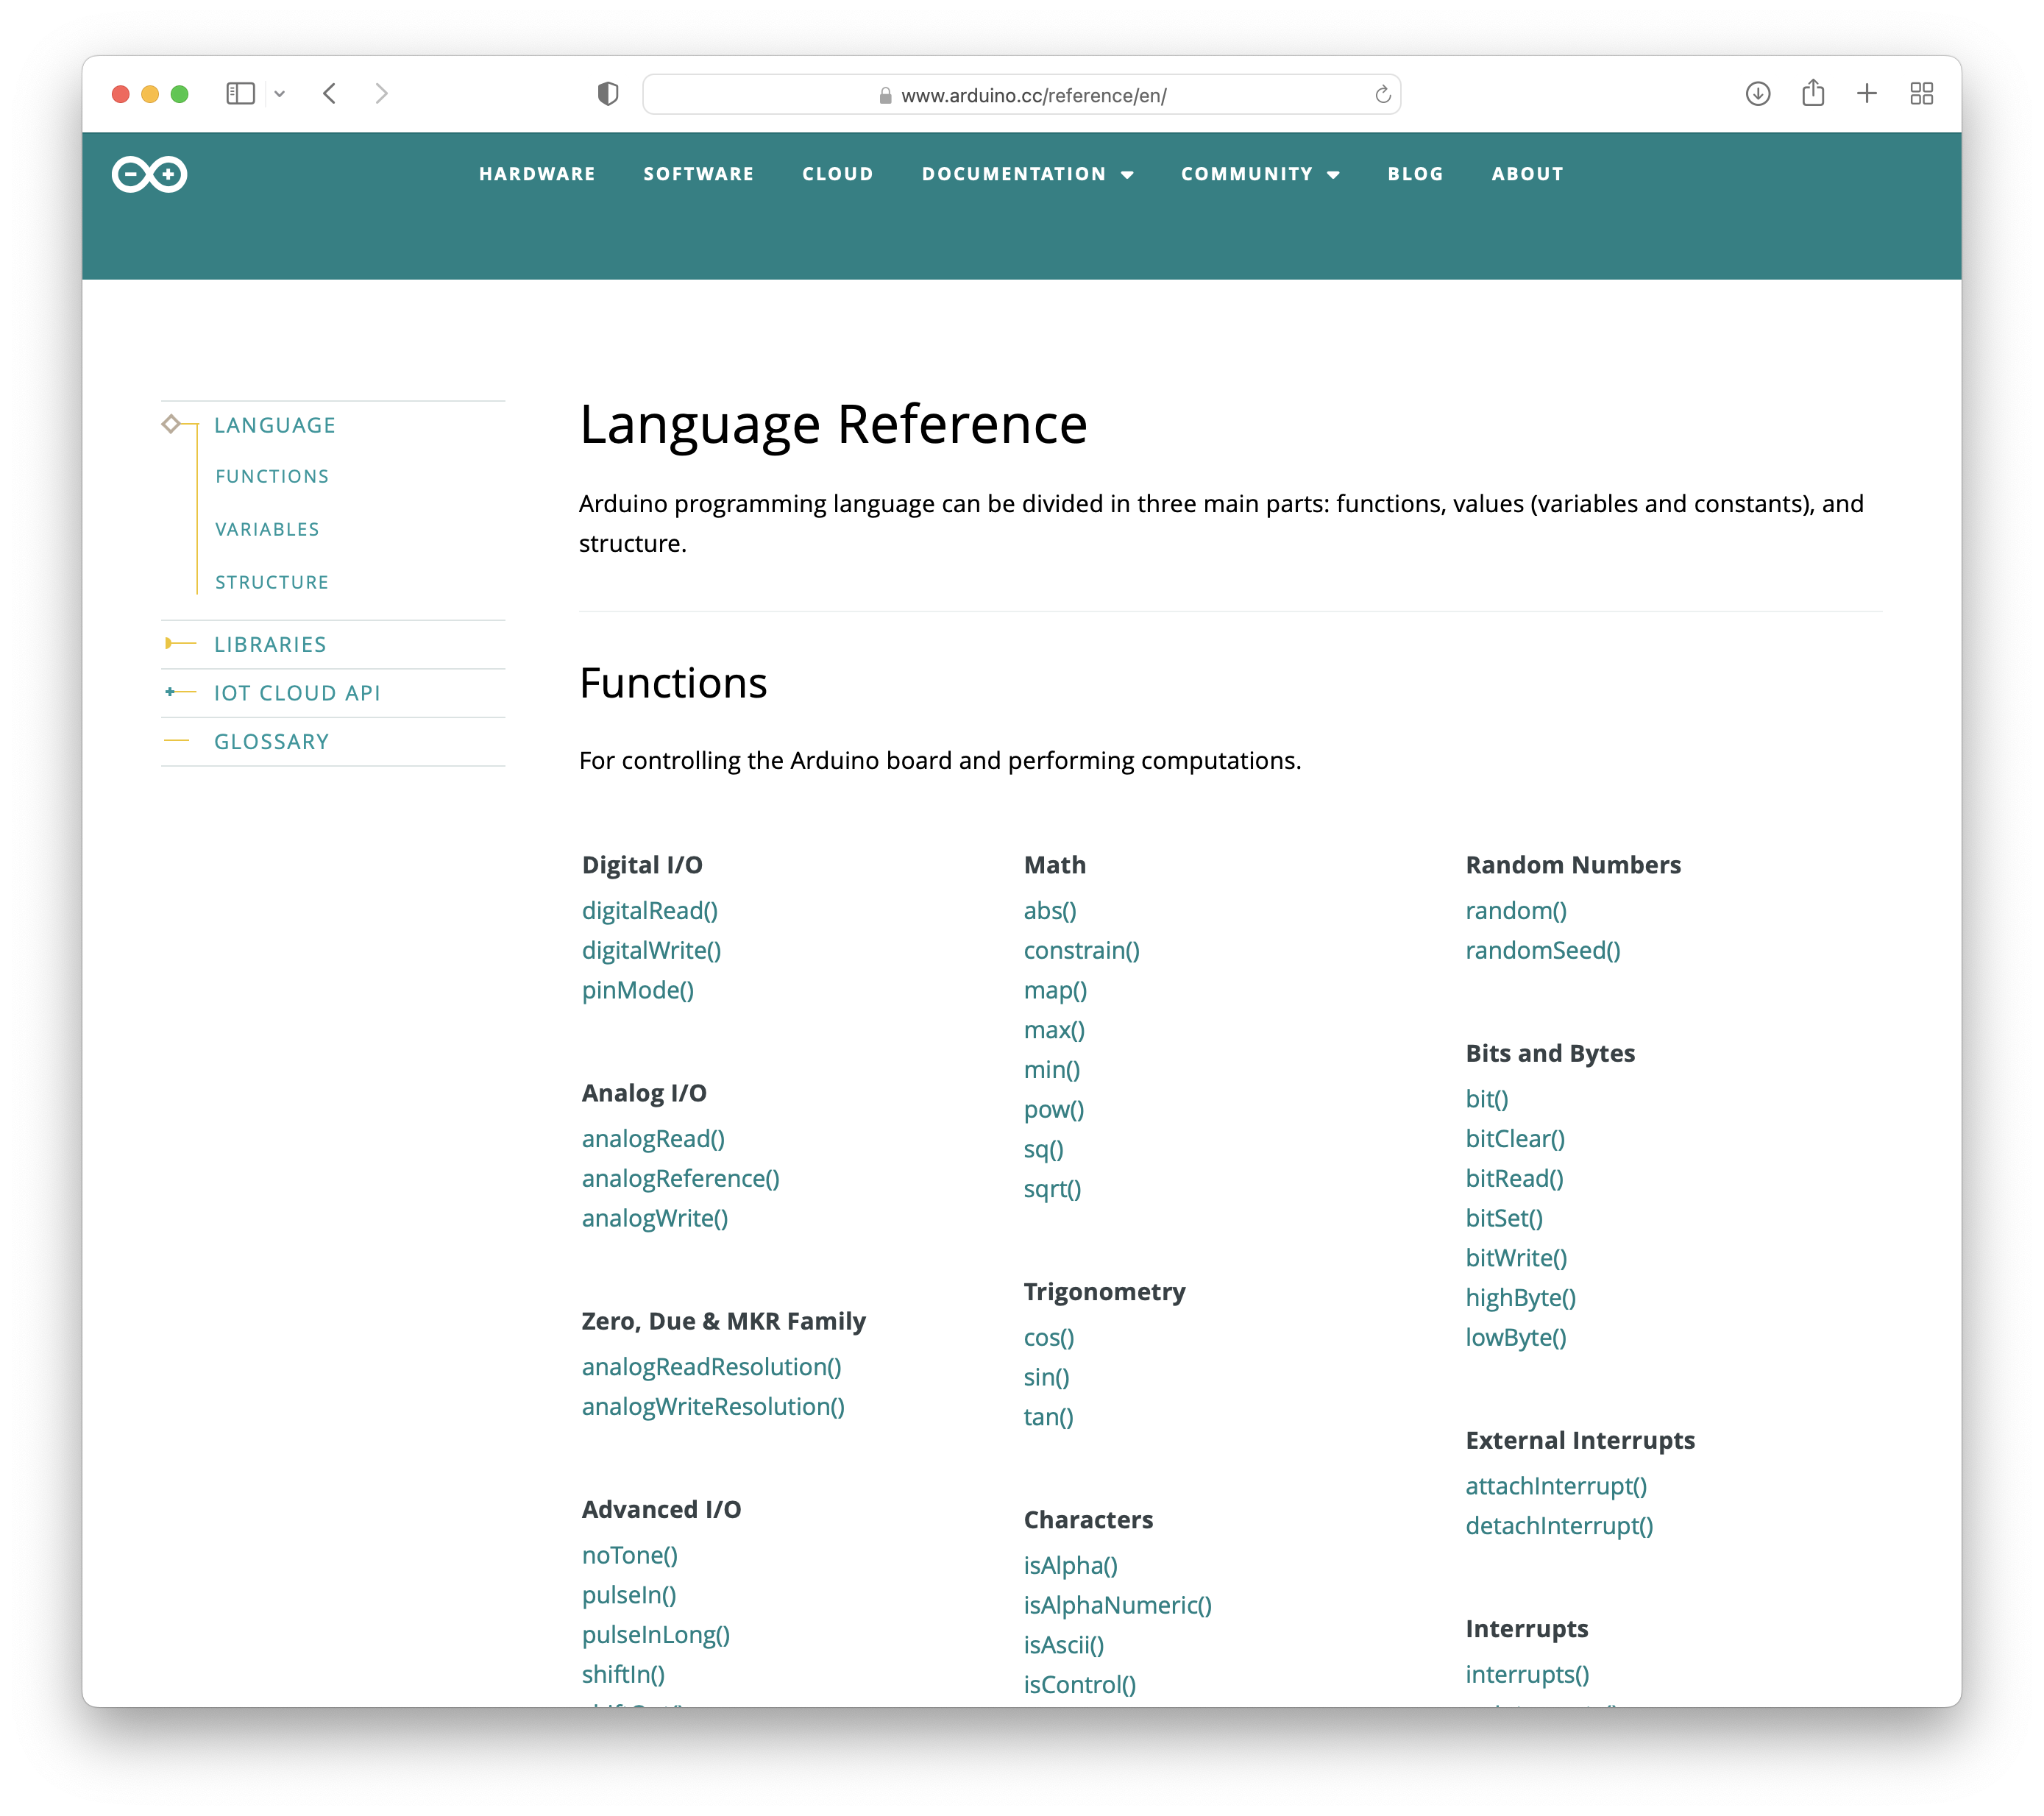
The Arduino Programming Referencehttps://www.arduino.cc/reference/en/
The language reference is something to get used to working with.
For example, we need to find some way to record the time:
millis()
This function just returns the number of milliseconds since the sketch started running. Learn how to use it here:
https://www.arduino.cc/reference/en/language/functions/time/millis/
void setup() {
  Serial.begin(9600);
}

void loop() {

  int sensorValue = analogRead(A0);

  // Add time to the serial out put.

  Serial.print(millis());
  Serial.print(',');
  Serial.println(sensorValue);

  delay(10);
}
Here is our familiar analog read sketch. We just added some more stuff to send to the console.
Serial.print() vs. Serial.println()
Data Format
A very common data format is the csv (comma separated values)
DataColumn1, DataColumn2
0.0,432
0.1,433
0.2,436
...
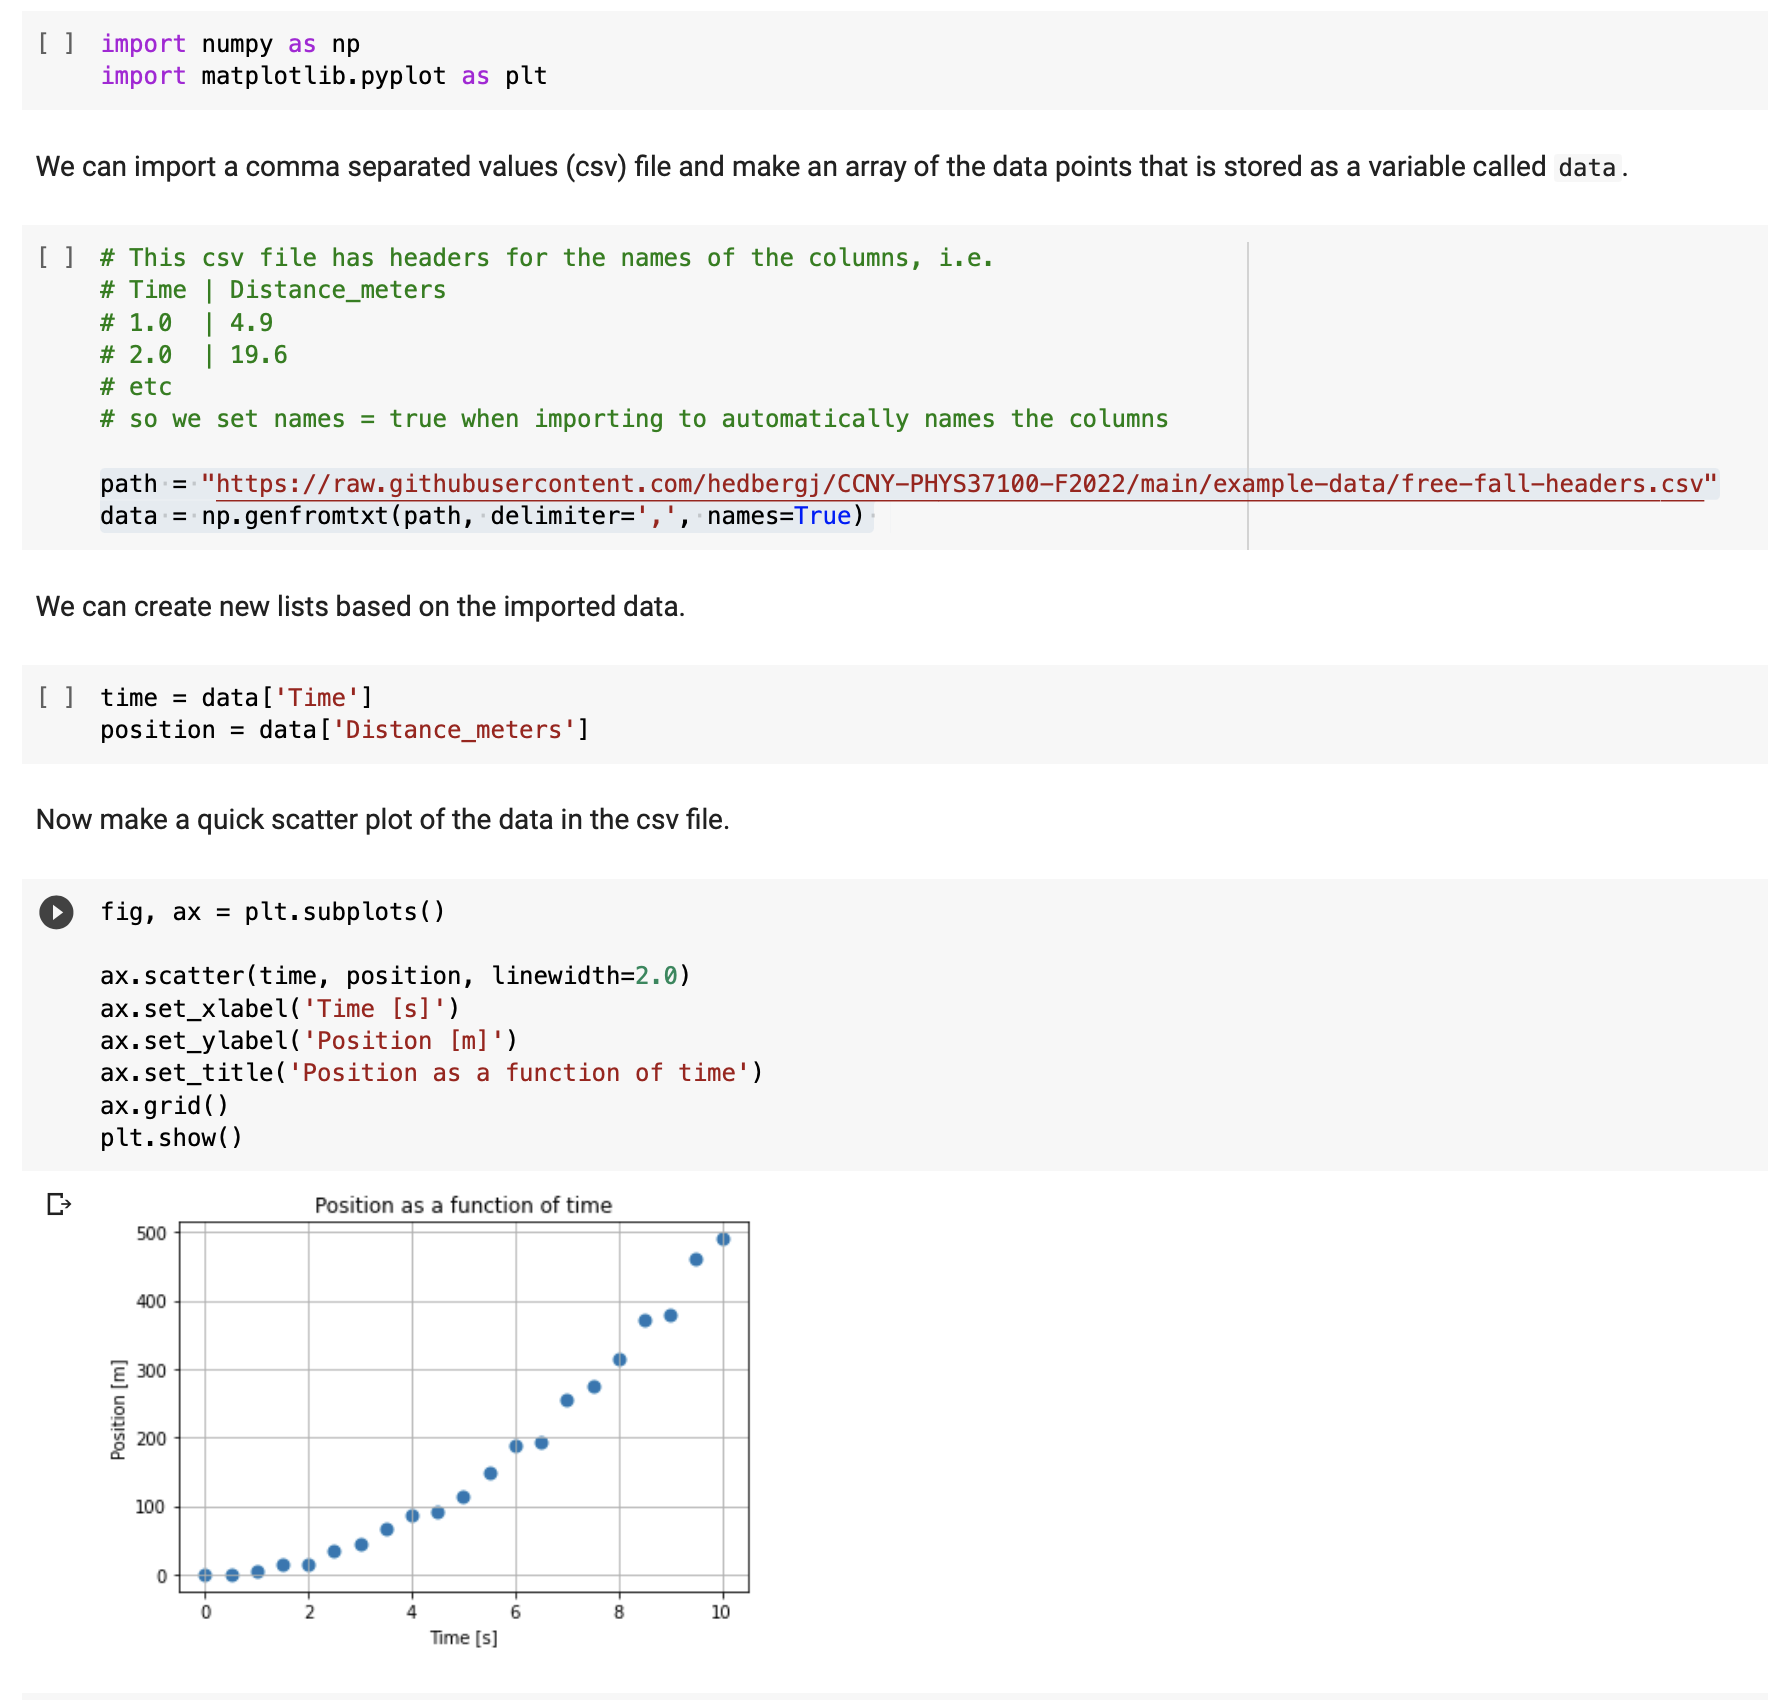
Example on how to read CSV from a file. Tutorial is here: https://hedberg.ccnysites.cuny.edu/PHYS371/tutorials/import-data/