PHYS 454, Homework 3
Spring 2024
Gather and Analyze some light
Build an optical spectrometer and take the following spectra:
- The Compact Fluorescent Bulb
- Mystery Tube
- Two light sources of your choosing (one continuous, one discrete)
Use the compact fluorescent as the calibration (more about this later) and then create calibrated plots for the mystery tube so you can identify the gas inside. Your two other light sources do not need to be calibrated (though you are welcome to try). Try to get one that is a continuous spectra, and another with discrete lines. This will require seeking out different sources of illumination.
notes:
- I'll give you a piece of black paper and some DVD-R bits. I have tape if you need some. I also have some extra webcams/old phones if you need a camera too.
- Here are some instructions: https://publiclab.org/notes/warren/11-30-2017/build-a-papercraft-spectrometer-for-your-phone-version-2-0
- The camera will record an image, but you'll need to extract a profile plot as well.
Due Date: Wednesday, March 20th, start of class. Via Blackboard. (1 pdf document named LASTNAME-FIRSTNAME-PHYS45400-HW3.pdf)
Specific Goals for your report
- Include 4 complete images and the extracted line spectra for each one.
- Figure out the Mystery Gas using spectroscopy (quantitatively, meaning with numbers, not just visual comparison)!
IMPORTANT: Don't leave the emission tubes on for more than 10 or 15 seconds at a time. Give them a break to cool down, or else they will end up taking a permanent break.
Here is the setup in Marshak 423. You will find the Mystery Gas tube and 1 compact fluorescent to do the calibration with.
Other tips:
You need to not move the paper spectrometer relative to your phone between images if you want the calibration to work out. A piece of tape can help. In other words, if the green peak shows up at row number 400 for example, then if you change the position of the paper spectrometer and take an image again, the peak might now be at pixel row 480 or something.
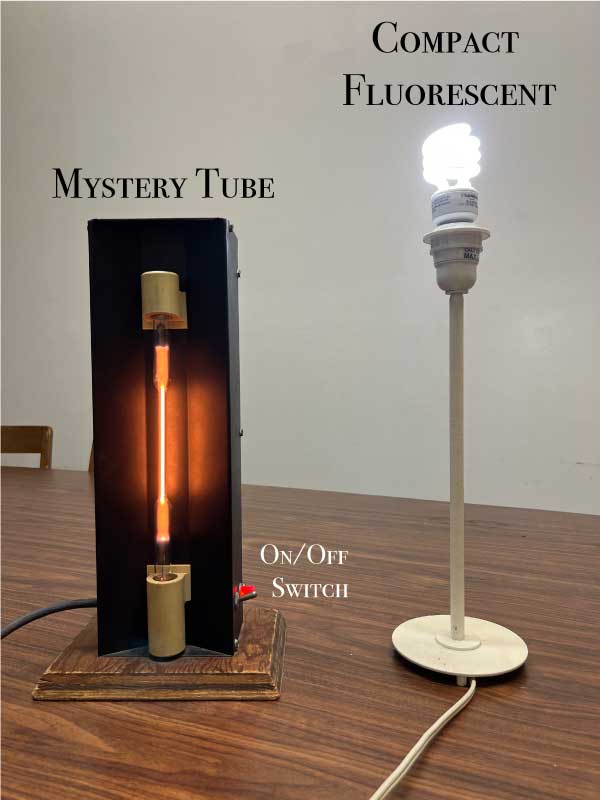
The setup in Marshak 423. Turn off the room lights when doing your experiment to avoid extra lines.
Try to avoid the following:
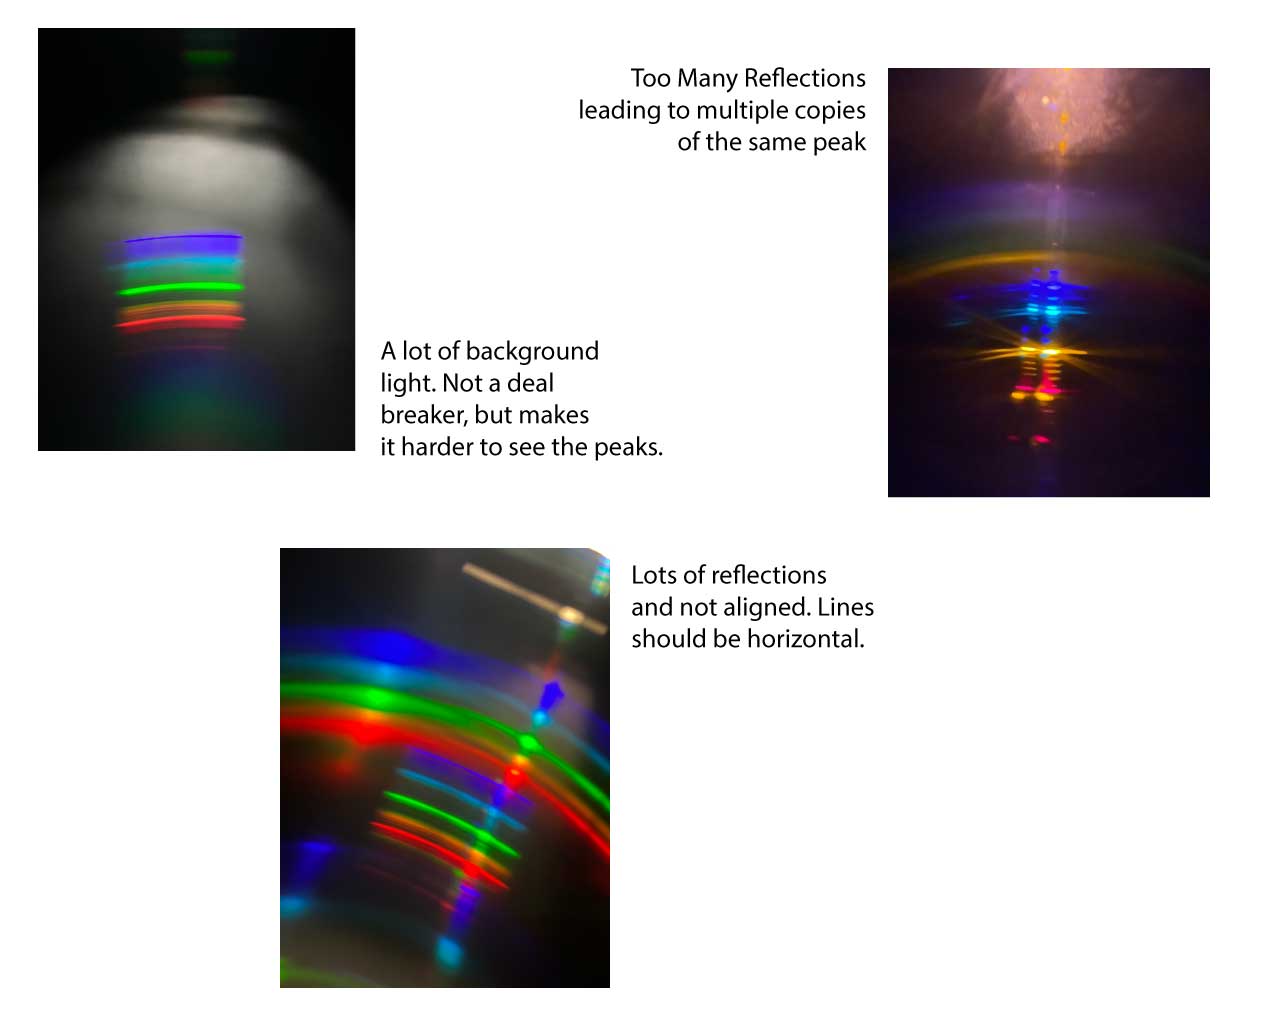
These are spectra, but not very nice ones and the analysis will be harder if not impossible.
This is an example of a good emission spectrum. Notice how the lines are nearly all horizontal and are lined up vertically, not at an angle. There is also no stray light or reflections.
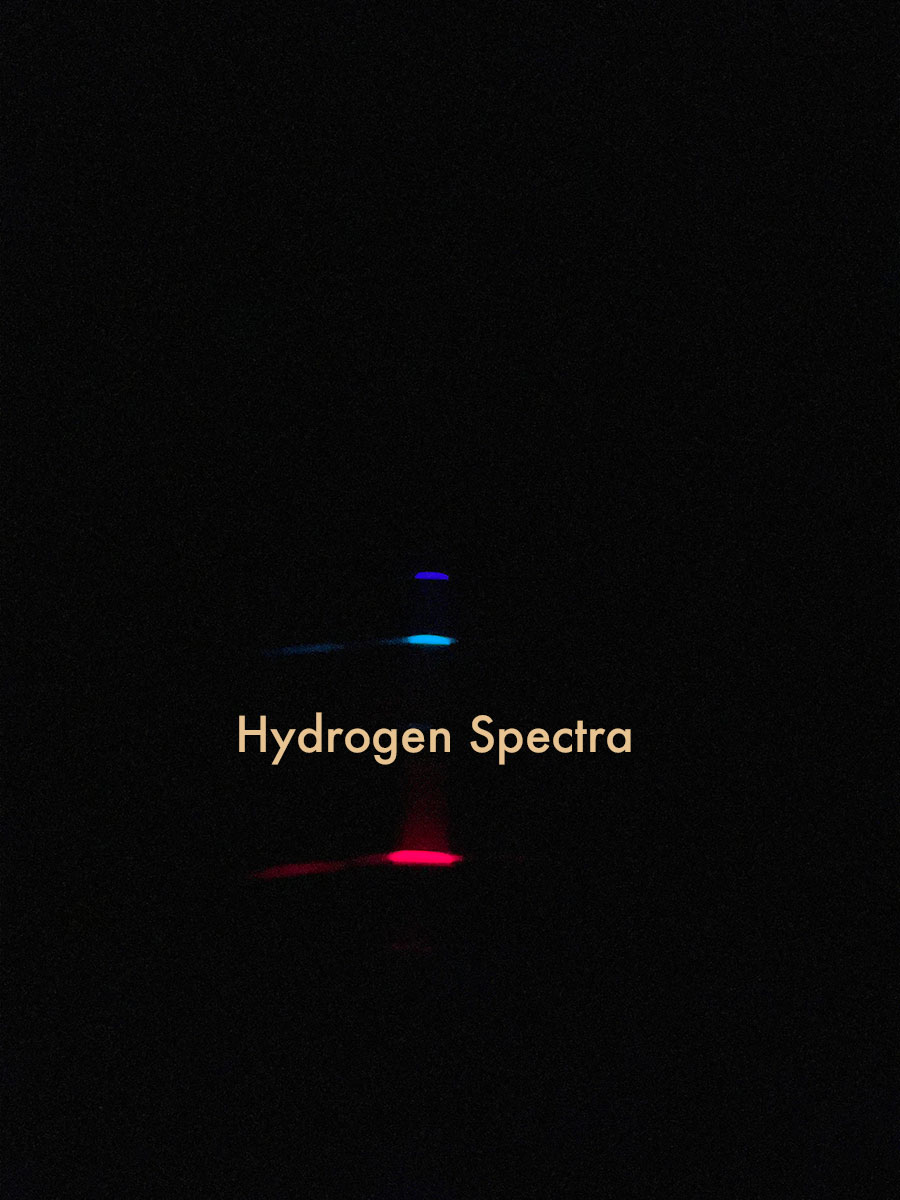
An example of a Hydrogen emission spectrum using the paper spectrometer.
Here is a spectrum using a real spectrometer for a compact fluorescent (CF) bulb. We can extract the peaks and see that there are 4 large ones:
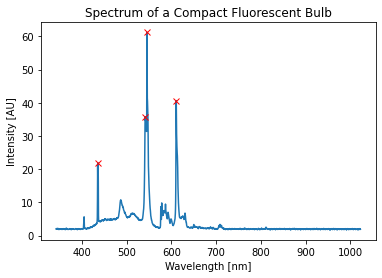
A Calibrated CF spectrum
- 436.594 nm
- 541.823 nm
- 545.736 nm
- 610.788 nm
You can use these values to calibrate your work.
After calibrating with the compact fluorescent, one can obtain a spectrum of the known gasses and compare to predicted values. In this case, the plot below shows the emission from a Hydrogen Tube. Notice the peaks at about 650, 490, and 430. These are close to the known Balmer series lines . (Could be closer if I had spend a bit more time... )
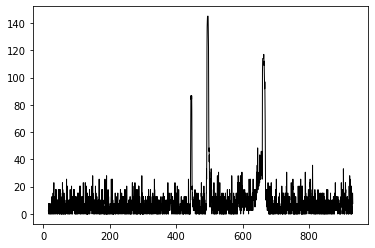
An example of a Hydrogen emission spectrum done using Python and the image above from the paper spectrometer.
The goal is to identify the wavelengths (in nm) for the peaks in the spectrum of the mystery tube, and the use those numbers to figure out what gas is in there.
Python examples are here:
- Images as Arrays Colab Notebook →
- Calibrating a Spectrum Colab Notebook →